Category: Research Notes
Alarm in the ICU ! Envisioning Patient Monitoring and Alarm Management in Future Intensive Care Units
Özcan, E., Birdja, D., Simonse, L., & Struijs, A. (2018). Alarm in the ICU ! Envisioning Patient Monitoring and Alarm Management in Future Intensive Care Units. In Service Design and Service Thinking in Healthcare and Hospital Management (pp. 421–446).
This article is fresh out of the oven!
The ICU’s in hospitals are equipped with advanced technology to increase the survival of the critically ill patients. Nevertheless, this same technology and their alarms has failed to work as a tool by clinicians: “long exposure to medical alarms induces alarm fatigue in clinicians and can cause patient delirium, or post-traumatic stress disorder” (pp. 422).
In this paper, the authors propose a new way to monitor patients and manage alarms inside an ICU. They state that how monitoring technology is used nowadays is not very different from when it emerged, in the 1950s, thus a revisit to patient monitoring is necessary.
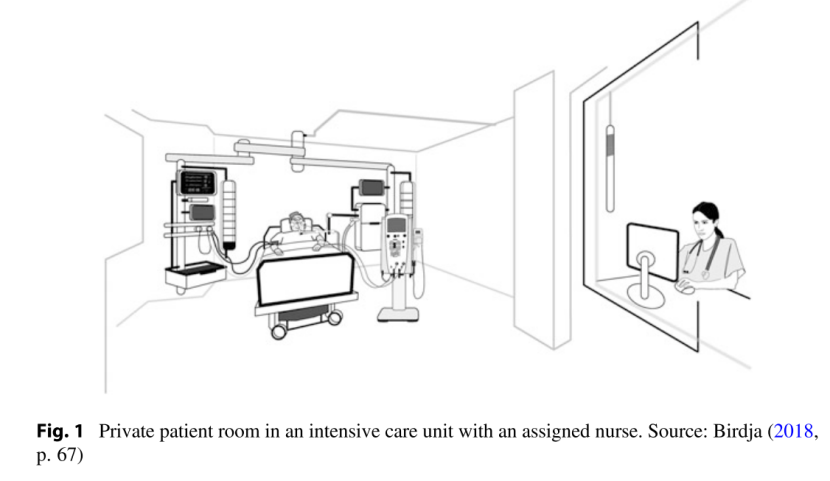
The premisse of the paper is that in the future, the hospital will have more critical cases in-house than regular cases. The latter will be monitores from distance. Thus an intelligent and seamless use of data is needed. One of the measures to achieve this is having a Central Alarm System: ” (…) It would be worth considering removing all sound from the medical devices and create a separate product dedicated to producing a specially designed set of sounds based on the data provided from the several monitoring devices in the ICU.” (pp.437).
The authors described their vision of the the future inside the ICU, and the interesting part is that they have showned it to experts in the field for validation.
Concert-hall Acoustics (3/3)
Pätynen, J., & Lokki, T. (2016). Concert halls with strong and lateral sound increase the emotional impact of orchestra music. The Journal of the Acoustical Society of America, 139(3), 1214-1224.
After several studies and hypothesis, the following experiments were made using skin conductance as an objective measure of arousal or emotional impact. This is interesting to correlate with the previous findings – and something i might be able to do soon.
For the listening tests 28 subjects were chosen. They were either music consumers or music professionals.
In the first experiment, they’ve listened to stimuli the following way:
Pilot signal + 15s Silence + 12 Stimuli (each with 15s Silence)
In the second experiment, participants made paired comparisons between two stimuli, and they had to choose the one that produced a higher overall impact on “you”. Impact was described as thrilling, intense, impressing or positively striking. Again, participants could jump seamlessly between stimuli to make the comparison.
Connecting the results with he plants from the rated concert-halls, it was possible to define the following conclusions:
– Halls with rectangular typology have a more impressive sound (because more sounds reverberate from the lateral directions);
– Positions closer to the orchestra were found to elicit stronger emotional responses.
The methodological interest I bring fromt these three studies is the possibility to seamlessly navigate trhough the stimuli in order to make a rating. this, nevertheless, makes a very specific rating, only to that sample.
Concert-hall Acoustics (2/3)
Lokki, T., Vertanen, H., Kuusinen, A., Pätynen, J., & Tervo, S. (2010, August). Auditorium acoustics assessment with sensory evaluation methods. In Proc. ISRA (pp. 29-31).
After this, I got interested in the method used and looked for more details. It seemed very similar to what I’ve done before with Kansei.
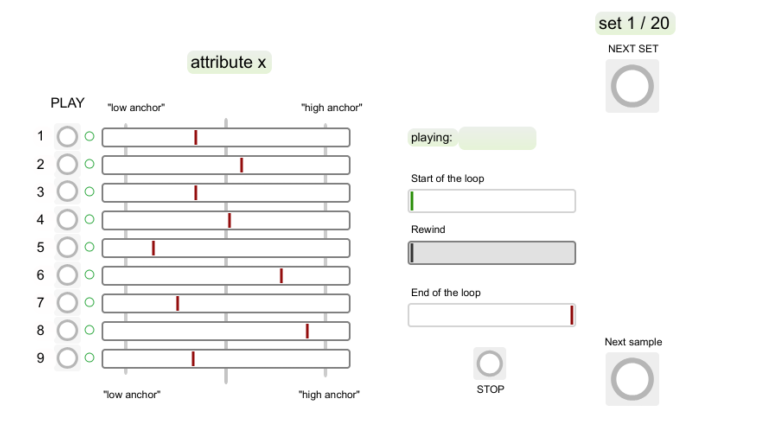
The previous study was made using this graphic user interface, where assessors could seamlessly switch between audio clips (just like between wine sips). The continuous scale ranged from 0 to 120.
The assessors were recruited via an online questionnaire with three parts: a) a pure tone audiometric test; b) a test for vocabulary skills, c) triangle test for the discriminative skills of audio stimuli (FromWikipedia: The assessors are presented with three products, two of which are identical and the other one different. The assessors are asked to state which product they believe is the odd one out)
20 assessors were selected, all with music background, and each made four sessions in total. In the first two sessions they made the attribute elicitation and in the last sessions they’ve used the attributes and scales.
As for the analysis, the classification of the attributes could be made manually, but it was made with AHC – Agglomerative hierarchical clustering. Than, further analysis were made using Multiple Factor Analysis (MFA), which has a PCA as basis. The results are presented here.
Concert-hall Acoustics (1/3)
Lokki, T. (2014). Tasting music like wine: Sensory evaluation of concert halls. Physics Today, 67(1), 27.
A few months ago, I read this article called “Tasting Music like Wine: Sensory evaluation of concert halls” by Tapio Lokki and was fascinated by two things:
– The lightness of the article and how it introduced such a complex topic as concert-hall acoustics with an anecdotal situation;
– The methodological intrincacy with all the 3D sounds recorded in such an enginious way (all orchestra musicians were recorded solo, placed 24 columns in a stage, each column playing only one instrument, and recorded the full “orchestra” in several places of the venue. Very simply put.)
– After all, there were three interesting things: I loved the use of Wine tasting know-how for the evaluation of the subjective experience of concert-halls.
So the situation is the author and his wife are listening to a concert while drinking some wine. While the wife enjoys the concert but not so much the wine, the author felt totally the opposite. Both perceived wine and music differently. After some thought, the author concluded that both wine and music have a lot in common, because each can be characterized by a multidimensional array of perceptual attributes.
Both are a matter of personal taste, and each person may concentrate on different aspects of the taste or sound. The thing is, winemakers have a solution for this, and have since long developed techniques to determine what makes good or bad wine.
Like the aroma wheel.
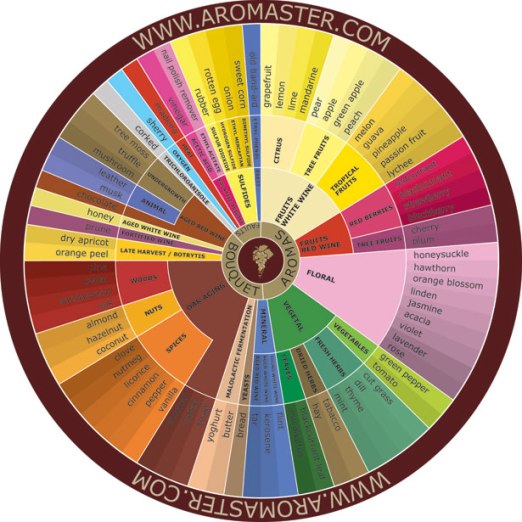
The first question than is: could these methods be tailored for the perceptual evaluation of concert-halls?
The wine tasting methods like sensory profiling demand comparison of samples, that is, imagine you have a table with a line of glasses, all with wines different from each other, and you may and must drink a sip from one and the other as many times as you, as an assessor, find necessary. Could this be made with sound?
The answer is yes, and please read the original article to find out how.
In winetasting two methods are used to gather attributes of wines: consensus vocalubary profiling, when a number of assessors reach a number of consensual adjectives for each wine; and individual vocabulary profiling – the one used in this work – where a number of assessors (usually 15 or more) salient which charactersitics can be found in the wine.
The first experiment had 20 listeners, and all heard 3 recording positions out of 3 Finnish concert-hals. Together, they’ve suggested 102 attributes. After clustering the data, one cluster (overall volume and perceived distance) managed to explain more than 50% of the variance.
The second experiment had only one distance – 12m from the stage -, 9 halls and 17 assessors. They’ve suggested 60 attributes clustered in 7 groups.
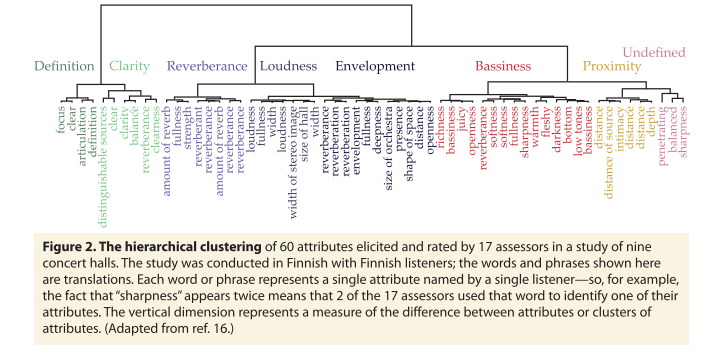
- Definition
- Clarity
- Reverberance
- Loudness
- Envelopment
- Bassiness
- Proximity
After more analysis (hierarchical multiple-factor analysis), it was possible to distinguish two groups out of this last evaluation (after ordering by preference also): one group preferred intimate sound in which they could easily distinguish individual instruments and lines, and another group which preferred louder and more reverberant sound with good envelopment and strong bass.
Very impressive how it was possible to understand this information. Would portuguese listeners make the same evaluation?
Urgency Analysis of Audible Alarms in The Operating Room
Bennett, C., McNeer, R., & Leider, C. (2011). Urgency Analysis of Audible Alarms in The Operating Room. In International Society for Music Information Retrieval Conference (pp. 771-776).
The objective of this study was to observe the acoustic features of audible alarms used in intraoperative environments. IEC-recommended alarms were used. The following table ilustrates these alarms, differentiated by various short melodies.

The first goal was to observe the primary salient auditory features of the IEC alarm set and to compare it to those of the experimental set. The second goal was to investigate the acoustical correlates of urgency perception.
Besides IEC sounds used as control stimuli, a new experimental set was developed by applying various audio effects to a pure-tone carrier; Since IEC alarms only manipulate melodic and temporal features, the experimental set manipulated: amplitude modulation, waveshaping, frequency modulation, phase randomization, and other basic sound synthesis and processing techniques.
Participants were presented 8 IEC alarms and 7 experimental alarms via two loudspeakers. Their task was to perceptually rate the stimuli on a 9-point Likert scale according to their perceived sense of urgency, anxiety, attention, and severity.
Results
The results showed that urgency was collinear (R2 = 0.95) with all of the other descriptors. As a result, the other descriptions (anxiety, attention, and severity) were removed from further analysis.
IEC alarms exhibited one auditory feature correlated with urgency, and the experimental alarms exhibited five.

Combined analyses of both data sets indicate that changes in an alarm’s spectral features over time are the largest contributor to perceived urgency.
Heterogeneity in auditory alarm sets makes them easier to learn
Edworthy, J., Hellier, E., Titchener, K., Naweed, A., & Roels, R. (2011). Heterogeneity in auditory alarm sets makes them easier to learn. International Journal of Industrial Ergonomics, 41(2), 136-146.
After all the reading I have done one thing appears to be a fact. Abstract alarms are harder to learn than everyday sounds, the sounds usually called “auditory icons”. But why? According to the authors, for a starter, everyday sounds are more heterogeneous, and so than can be easily learned not for semantic reasonds, but for psychoacoutic reasons. These sounds however – unlike mentioned on the previous post – can have problems in being faced as “alarms”, as people tend to be conservative as to what is an acceptable sound alarm.
In 1956 Miller suggested that the people’s ability to learn and retain information was positively correlated with the number of dimensions in which the item differed. Could this logic be applied to alarm sounds? If the number of dimensions that differ among sounds more sounds can be learned and retained? This was what the authors proposed to analyze in four different studies. The context was the rail industry.
#1
The following table shows all seventeen existent alarm sounds. Some have different timbres, all have different meanings.

Participants were presented a pair of alarm sounds from the pool using loudspeakers. Their task was to rate how dissimilar s/he felt the two alarms were (confusability experiment) using a 10 item Likert-scale.
A hierarquical cluster analysis was made and the results demonstrated that most alarms are highly clustered, meaning that they are understood as being very similar.
#2
The following study analyzed if the similarities between alarms found in #1 affected people’s ability to learn them. The procedure had a familiarisation and a learning phase. In the first phase, participants read the names of the alarms in cards. The experimenter showed a card and then played the corresponding alarm, and participants had to know the names of the alarms. Feedback was given to participants – correct/incorrect – correct response.
The results were not very positive: two alerts were recognised correctly 80% or more of the time; 9 alerts were recognised correctly more than 50% of the time and the remainder were recognised correctly less than 50% of the time, with some being recognised correctly less than 20% of the time.
#3
For the third experiment a new set of sounds was designed including different classes of sound, including distinct temporal patterns in all alarms and including some auditory icons.
This experiment was similar to #1, but the results achieved were far better as alarms were less homogenous.
#4
Again, experiment #2 was replicated with the new set of sounds.
The learnability of these new alarms was considerably higher than the set tested in Experiments 1 and 2. 7 were recognised correctly >80% of the time (three more than 90% of the time), and all but one were recognised >50% of the time, with the least recognised alarm falling just under the 50% mark.
—
The general discussion is very rish and should be closely read. What caught my attention was that auditory icons did not outperform abstract sounds, although they have obtained good results. The authors refer that one important area for future research is to determine whether the apparently easier learnability of auditory icons stems from their object-sound associations or from their acoustic heterogeneity. It is likely that the source is some combination from the two, but for design purposes it is important to knowas greater heterogeneity in abstract alarms seems also to enhance their learnability.
Communicative functions of sounds which we call alarms
Pirhonen, A., & Tuuri, K. (2010). Communicative functions of sounds which we call alarms. In Proceedings of the 16th International Conference on Auditory Display ICAD 2010 (pp. 279-286).
This paper caught my attention because it provides qualitative guidelines that can shape a good alarm sound. The methodology used to gather the information is also very creative, and it’s good to see there’s a world beyond frequent frequencies, loudness and intervals. The setting is an anaesthesia workstation.
The method used was the RUS – Rich Use Scenario. This method focuses on the experiences of the user as a person, and so it uses lively stories with a rich imagery of how a product or application is used under an envrionment familiar to the listener or reader – they shoul feel identified with the story. In brief, the method intends to answer: How would the character experience this or that idea?
In this case RUS was applied as a radio play. According to the authors, this means of presentation is suited for the brainstorming of sounds. The procedure was the following:
1. The manuscript for the radio-play was prepared in cooperation with the experts in the context (usability experts of the manufacturer).
2. The radio play was implemented. In the radio play, the sounds-to-be-designed appear as points of ”missing” sound effects, allowing them to be imagined.
3. Two design panel sessions were organised. The participants were six students of different subjects. However, none of the participants had medical science as a major subject, i.e. the participants were amateurs in terms of the context. In the sessions, the participants planned and implemented appropriate sound effects at the given points of the radio-play (which were sounds from the anaesthesia workstation).
4. On the basis of the work of the non-expert design panels, draft sounds were implemented and embedded in the radio- play.
5. Two expert panel sessions, each made up of two anaesthesia nurses and one doctor, were conducted. In the sessions, the final radio-play, including the sound effects, was listened to and discussed.
6. A post-questionnaire was sent to all expert panel participants.
7. The discussions of the expert panels were transcribed and analysed.
Analysis
The analysis was made to four different sounds for different conditions representing different levels of warnings in an anaesthesia workstation. It consisted in transcribing the participant’s opinions on the proposed sounds, and how could they be improved. Here’s an example for a “Medium Priority Alarm”:
The draft sound was produced with a metallophone. It consists of series of two damped hits at approximately 1 sec. intervals (D# tone, medium register). The events causing the alarm condition in the scenario were:
• Blood pressure has exceeded the alarm level (patient based alarm)
• The entropy meter is badly connected (device based alarm).
General observations concerning design principles:
• In expert panel 1, the events of the scenario were found different in priority:
. . . but I think that if blood pressure has really been too high, it is quite different and requires different reaction than a badly connected entropy sensor – if it has not been pushed in tightly enough thus losing contact.
• Expert panel 2 wished medium-level alarms to be merely informing rather than alarming:
. . . It has to be noted, that ‘aha’, but not anything more severe, let’s sign for it in a few minutes. But if you are busy with other, important tasks and that is tapping away all the time in the background, it would rile.
. . . it obviously depends on the scale – what is classified as important.
Opinions about the draft sound:
. . . Perhaps a bit too feisty. . . kind of loose. . .
. . . should not be that dense. . . . . . I don’t like that metallic tone, it’s irritating. . . . . . [should be] somehow softer. . .
. . .Were there two taps? Perhaps rather. . . well it de- pends on the qualities of the sound but perhaps one of that kind would be good.
. . . since there were two of them [taps], it made it kind of commanding, like ‘hey, . . . !!’
Features of the sound:
• Medium-level alarm should not be too loud, obtrusive nor frequent.
. . . perhaps high priority alarm should be something like this (tapping continuously) to grab attention, but these kind of sounds in which no immediate reaction is necessary, perhaps simple [“bø:b] would be adequate.
• On the other hand, it should be snappy and adequately startling.
• Soft, non-metallic timbre would be desirable.
• Single-tone structure (instead of two tones) and longer pause between repetitions (at 10-15 sec intervals) was proposed.
The comments indicated that the challenge is to design low and medium priority alarms, for most of the times they startle or irritate, and participants stated they should be softer, less metalic. The main conclusions:
High priority alarms
• Sounds can clearly be even more alarming – in terms of perceived urgency – than the sounds which follow the standard.
• Even if it can be assumed that there is an immediate reaction to the alarm, continuous alarm signals are not recommended.
• Melodic structures do not seem to be perceived as alarming; possibly quite the contrary.
• Percussive sounds appear to be favoured, at least by our panels, i.e., the underlying mental model or action model is to warn by beating, stamping, knocking etc.
Medium priority alarms
• The sound needs to get attention, but excessive commanding or sharp quality should be avoided.
• One single soft sound object, repeating at about 10 second intervals, could be adequate. The alarm sound ISO standard provides an appropriate guideline for the frequency of repetitions.
• Sound objects could be constructed in terms of the burst definition in the ISO standard. The strictly defined structure of burst should be broken up, though. Sound objects do not need to be mechanical, beeping pulses either.
• Attention should be paid to the timbre and internal dynamics of sounds. Crucial factors in the perceived softness are onset (attack) and offset (release) phases of a sound object and the legato between separate objects.
• Percussive sounds did notwork in the panels. The related action model should be softer than beating, e.g. arched swing, circular movement or waves.
• Even though it is a question of an alarm, the dominating communicative function should not be commanding or
alarming, but something more subtle.
Low priority alarms
• The sound should be noted, but all commanding or sharp qualities should be avoided.
• Close resemblance to a medium-priority alarm, but more subtle, soft, ”round”, simpler in structure and more
peaceful.
• Alarming qualities – in the traditional manner – should not be included at all.
• One single, very subtle sound object, repeating at 15-30 second intervals. The standard is a good basis for defining the interval.
• A burst consisting of two melodic sounds, suggested by the standard, appears too obtrusive for low priority alarms.
• Communicative intention should be to guide attention or inform with subtle, pleasant means. A commanding or alarming quality is not at all appropriate.

Designing urgency into auditory warnings using pitch, speed and loudness
Haas, E. C., & Edworthy, J. (1996). Designing urgency into auditory warnings using pitch, speed and loudness. Computing & Control Engineering Journal,7(4), 193-198.
The perception of urgency in an audio alarm is affected by several factors and parameters. In Patterson’s Pulse method for the creation of “customizable” audio alarms, the pulse can be manipulated in terms of fundamental frequency, the degree of inharmonicity, the pulse’s amplitude envelope,and so in terms of burst rhythm, speed, melodic pattern, pitch contour and length.
This study intended to investigate the effect of pulse fundamental frequency, pulse level and inter-pulse interval on the perceived urgency of warning signals; to investigate the effect of these variables on the response time to warning signals; and to examine the relationship between perceived urgency and response time to warning signals.
The stimuli
27 auditory signals were used, each made of a train of four pulses. Each pulse had a duration of 350 ms, including an onset time of 25 ms and an offset of 25 ms. The total signal time was a minimum of 1.4 s (at 0 ms inter-pulse interval) and a maximum of 3.4 s (at the 500 ms inter-pulse interval).
Inter-pulse interval is the time elapsed from the end of the offset (decay) of one pulse to the beginning of the onset of the next.
The times were 0,250 and 500 ms. Pulse onset was the time from the waveform’s increase from zero amplitude until it reached maximum output. Pulse offset was the reverse.
The three fundamental frequencies used were 200, 500 and 800 Hz.
The signal with a fundamental frequency of 200 Hz had components of 200, 400, 600, 800 and 1000 Hz.
The signal with a fundamental frequency of 500 Hz had components of 500, 1000, 1500, 2000 and 2500 Hz.
The signal with a fundamental frequency of 800 Hz had components of 800, 1600,2400,3200 and 4000 Hz.
Signals with a fundamental frequency of 1000 Hz and greater were avoided because the high-frequency components normally make the signals sound aversive.
The pulse levels were set at 5,25 and 40 dB LIN SPL above the ambient noise level.
Each signal was presented twice, in random order, and the participant verbally rated the perceived urgency. In another task, the participant had to react to the signals with the dominant hand as soon has s/he detected it.
Results Perceived Urgency
All three variables affected the perception of perceived urgency.
Signals with a fundamental frequency of 200 Hz sounded significantly less urgent than those containing 500 Hz or 800 Hz fundamental frequencies. Participants rated signals with an inter-pulse interval of 0 ms as sounding significantly more urgent than those containing intervals of 250 ms and 500 ms. As for loudness, participants rated signals 40 BLW above ambient as significantly more urgent than those 25 dB LIN above ambient.
These results suggest that a strong perceptual difference is elicited by temporal differences in signal construction.
Results Reaction Time
For the reaction time results, the effective variables were pulse level and fundamental frequency.
Signals with a fundamental frequency of 800 Hz had a significantly shorter response time than those with a fundamental of 200 Hz. Response times for signals 240 dB LIN above ambient were the shortest, followed by signals 25 dB above ambient, and those at 5 dE3 LIN above ambient.
Response time to signals decreased differently as fundamental frequency and pulse level increased, and as inter-pulse interval decreased.
Pulse level and fundamental frequency are the signal design characteristics which consistently affected all measures of perceived urgency and response time.
One topic for future research could involve defining the point at which fundamental frequency no longer produces differences in perceived urgency.
Visual Search Performance With 3-D Auditory Cues: Effects of Motion, Target Location, and Practice
McIntire, J. P., Havig, P. R., Watamaniuk, S. N., & Gilkey, R. H. (2010). Visual search performancke with 3-D auditory cues: Effects of motion, target location, and practice. Human Factors: The Journal of the Human Factors and Ergonomics Society.
This was an interesting paper because it was the first to approach the facilitator effects of 3D audio cues applied to moving stimuli.
A lot of previous research has demonstrated that 3D audio does reduce the time of visual search, the subjective workload, etc. However, to the authors knowledge, all research on the subject was made using static targets among static distractors, and this paper addresses this gap by using an environment with dynamic stimuli.
The set-up was similar to a regular searching task. The participant’s head movements were monitored via a head-tracking system. The auditori stimuli were presented via headphones. The sound cue consisted of three consecutive 50-ms bursts of wideband white Gaussian noise separated by 25-ms gaps of silence and ending with 250 ms of silence, totaling 450 ms. The sample rate was 44,100 samples/s. The cue was repeated during each trial in the auditory conditions until a response was given and was presented at a comfortable listening level, approximately 50 to 60 dB SPL. The sound cue was filtered with the use of a generic set of head-related transfer functions (HRTFs) in the National Aeronautics and Space Administration’s Sound Lab software (see SLAB, n.d.; also see Miller & Wenzel, 2002).
When coupled with the head-tracking sys-tem, the SLAB software rendered the auditory cue so that it was collocated with the visual tar-get (dynamic or static) regardless of where the participant’s head was pointed.
During the task, the participants has to look at a display with 15 distractors and 1 target, find the target, and respond in which side of the target was the stimuli gap – it was a two-alternative forced choice procedure.

There were four conditions to the experiment: 1. static environment with no audio cues; 2. static environment with 3D audio cues; 3. dynamic environment with no audio cues and; 4. dynamic environment with 3D audio cues. In totality, the experiment recorded 2,816 trials per participant: 4 (sessions) × 4 (con- ditions) × 176 (trials per condition).

From the results, it was clear that conducting visual searches in moving environments was more difficult than searches in static environments, regardless of whether 3-D auditory cues were present. The significant main effect of auditory cue indicates that average search times decrease when 3-D auditory cues are provided, regardless of the search environment. The auditory cues reduced overall search times by an average of 430 ms (from 1,800 to 1,370 ms), an improvement of 24%.

No practice effects involving 3-D audio were found, and the beneficial effects of 3-D audio were evident in the first experimental session, supporting its purported ease of use.
As for the angle of the starting location of the target, it had a strong effect on search times and on the effectiveness of 3-D audio. Search times were generally faster when targets were located closer to the fixation point (smaller eccentricities) and when located on the horizontal plane. Importantly, 3-D audio provided the largest benefits to search performance when the target appeared at farther eccentricities and/or on the horizontal plane.
As a conclusion, the author write some ideas for future research. Objects in the real world often move on nonlinear paths in three dimensions and may appear anywhere in the spatial environment. So it may be appropriate to examine different types of motion and search-field sizes in future research.
53 interesting ways to communicate your research
The blog Thesis Whisperer has recommended a long time ago an interesting book with hints on how to communicate research.
I will paste some hints he published on his website. The book is available on Amazon. I just feel this hints will come handy in the future.
- Include a QR code on your conference posters Suggests Steve Hutchinson. One of the challenges of the poster format is how to avoid doing what Hutchinson calls ‘your thesis on a sheet’. The short section on posters includes advice on word count (400 – 600) and suggests that you use a QR code to lead people to more information. Genius.
- Visual Cognitive dissonance (VCD) is an interesting technique suggested by Debbie Braybrook. VCD happens when the audience is confused by how the image on your slide relates to what you are saying. The book points out that this can be used as a kind of ‘visual cliff-hanger’ to keep your audience interested, so long as your verbal presentation eventually helps them make the connection.
- The ‘news hook’ is a key ingredient of the op-ed piece says Eleanor Carter. Op Eds tend to be about 800 words long and relate in some way to current events. A common tactic is to make a “simple statement of the argument” the author wants to confront, and then spend the rest of the words making a counter argument. Something all researchers should be good at!
- Consider using objects in your presentations says Anthony Haynes. If you are presenting your scientific experiment, why not bring in some of the equipment? If you are doing a history thesis, maybe you could bring in objects from the period (or reproductions). This tactic works, the author argues, because we are all used to slides. The shift into 3D is unexpected and can make the audience curious about what you have to say.
- Mix up the ‘texture’ of podcasts says Lucy Blake. The most interesting podcasts are composed of more than one voice or type of sound. Try getting a friend to interview you, make a podcast of a group discussion or record other kinds of sounds and cut them in.
- When presenting, think in threes suggests Aiofe Brophy Haney. Good stories have a beginning middle and end. The end should ‘resolve’ the story somehow. suggests a 3×3 matrix. Here’s one I made for a 20 minute presentation on social media I have to do in a couple of weeks time:
Topic: how to grow and use your social networks
| The strategies | The tools | The problems |
| Finding and following the right people | Twitter / Facebook / Linkedin | Dealing with ‘information smog’ |
| Feeding your network | Flipboard / Scoop-it / Twitter | Remembering where you put stuff |
| Contributing to the conversation | Micro-blogging Being a good commenter |
Finding time within your schedule and space in your job description |
- Keep a checklist of Tweet types. Sara Shinton points out that some people can fear Twitter because they don’t know what to say. She provides a short, but useful list of possible tweets: signpost to resources (links to other blogs, journal articles); publicise an event, react to something (a news article, a conference presentation) or ask for help.
- Think about how to repackage yourself and your skills in a job interview says Caron King, who breaks down the process of describing yourself and your skills into three ‘E’s’:
- Elicit everything you know and have done by writing it all down.
- Explain what you have done and delivered, including the impact you have made.
- Then think of how to provide evidence, using data wherever possible.
- There are only five types of questioner says Lucinda Becker: Confused, Oratory (basically intent on giving a mini lecture disguised as a question), aggressive, unexpected and helpful. She goes on to give good advice about how to deal with each type.
- When going for a non academic job, speak the employer’s language says Steve Joy. Planning experiments becomes ‘project management’, Supervision becomes ‘leadership’, presenting at conferences becomes ‘engaging with stakeholders’.
